
The Business Cycle Explained: Expansion to Contraction
A practical walkthrough of the four business cycle phases and how to identify where Malaysia’s economy sits in the cycle using real indicators and historical examples.

Understanding Economic Rhythm
The business cycle isn’t some abstract concept—it’s the rhythm that drives real decisions. When you’re analyzing Malaysia’s economy, you’re tracking these phases constantly. Expansions bring hiring surges and rising consumer confidence. Contractions mean tightening budgets and shifting investment strategies.
Here’s the thing: recognizing which phase we’re in matters enormously. It shapes whether companies expand operations, whether unemployment ticks up or down, and how policymakers respond. We’re going to walk through all four phases—expansion, peak, contraction, and trough—and show you exactly what indicators tell the real story about Malaysia’s economic position.

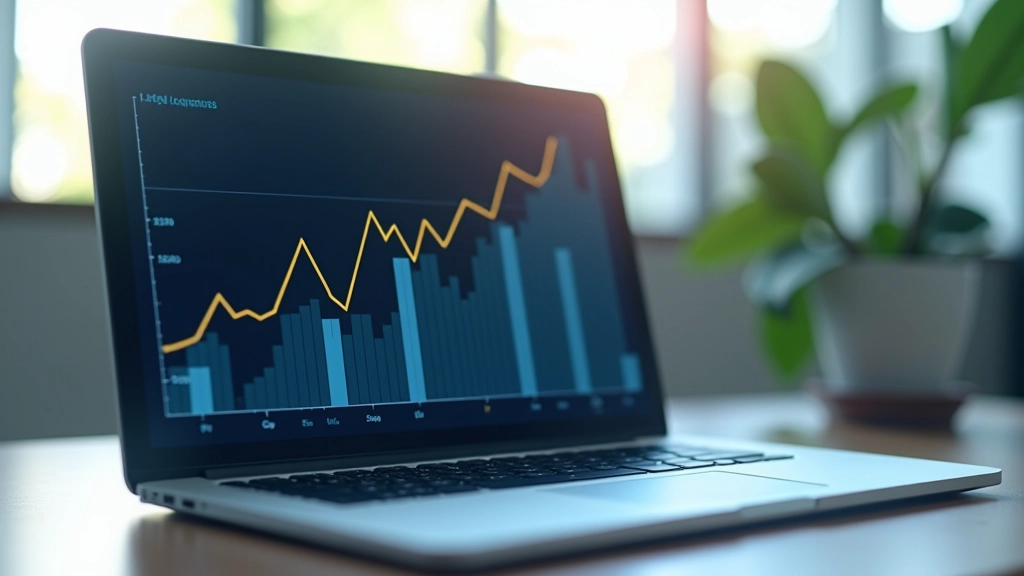
Phase 1: Expansion — The Growth Engine
Expansion’s the honeymoon phase. GDP climbs, unemployment falls, and businesses feel confident enough to invest in new equipment, hire staff, and expand operations. Malaysia experienced a solid expansion period from 2016-2018, when real GDP growth averaged around 5-6% annually.
Key Expansion Signals
- Rising industrial production (up 3-5% year-on-year)
- Unemployment drops below 3.5%
- Retail sales accelerate, consumer confidence climbs
- Corporate profits improve, investments in capacity increase
- Construction activity picks up, building permits surge
During expansion, you’ll notice wages creeping up—competition for talent intensifies. Interest rates typically stay moderate because central banks want to support growth without overheating things. The key here is sustainability. Expansion can’t last forever, but while it does, it’s the ideal time for businesses to strengthen their balance sheets and invest in future productivity.
Phase 2: Peak — The Inflection Point
The peak’s where things get tricky. It’s not a collapse—it’s the moment when growth stops accelerating and starts stabilizing. You’ll see GDP growth flatten out, inflation pressures mount, and central banks get nervous about overheating. Malaysia hit its most recent peak around 2021-2022, when growth rates started normalizing after the pandemic recovery bounce.
What happens at the peak? Asset prices often reach their highest levels. Real estate values peak. Stock market valuations stretch. Wage growth remains strong, but productivity struggles to keep pace. It’s not obvious when you’re at the peak—that’s the challenge. Economists only confirm it months later when the data’s settled.
“The peak feels like normalcy. You’re not seeing dramatic warnings—you’re seeing a slowdown in acceleration. That’s when vigilance matters most.”


Phase 3: Contraction — The Adjustment Period
Contraction’s where things tighten up. GDP growth turns negative (that’s the technical definition), unemployment rises, and business confidence weakens. Companies postpone expansion plans, hiring slows dramatically, and consumer spending becomes cautious. Malaysia faced a significant contraction in 2020 when COVID hit—GDP fell 5.6% that year.
You’ll see concrete changes during contraction: retail sales drop, manufacturing orders decline, and investment in new projects gets shelved. Wage growth stalls. Some sectors get hit harder—tourism and hospitality typically suffer first. But here’s what’s important: contraction doesn’t mean total collapse. It’s painful, but it’s temporary. Central banks respond by cutting rates, governments implement stimulus, and gradually conditions stabilize.
Phase 4: Trough — The Bottom and the Bounce
The trough’s where the contraction bottoms out. It’s not pleasant, but it’s the turning point. GDP stabilizes at its lowest point, unemployment peaks, and sentiment reaches pessimism. But here’s the crucial insight: troughs create opportunity. Asset prices are depressed. Labor’s available. Interest rates are low. Investors who recognize the trough and act accordingly often make their best decisions then.
Malaysia’s trough from the 2020 contraction occurred in the second quarter—unemployment hit 4.8%, one of the highest levels in recent history. But by Q3, hiring picked up again. Stimulus measures kicked in. Consumer spending gradually returned. The recovery didn’t happen overnight, but the trajectory shifted from down to up.
What makes a trough recognizable? When indicators stop deteriorating and start stabilizing. Unemployment stops rising. Retail sales stop falling. Manufacturing orders stabilize. It’s subtle, but it’s the signal that expansion’s about to restart. This is when confidence gradually returns, and the cycle begins again.

Reading the Indicators: Your Practical Toolkit
Knowing the phases is one thing. Identifying which phase you’re in requires watching specific indicators. Malaysia’s economy shows its position through several reliable signals:
GDP Growth Rate
Expansion: +3% to +6%. Peak: +1% to +3%. Contraction: Negative. Trough: Stabilizing near 0%.
Unemployment Rate
Expansion: Below 3.5%, falling. Peak: Stable around 3-4%. Contraction: Rising toward 4.5-5%. Trough: Peak unemployment, then stabilizing.
Industrial Production
Expansion: Growing 3-5% YoY. Peak: Growth slowing to 1-2%. Contraction: Negative growth. Trough: Stabilization signals recovery coming.
Retail Sales
Expansion: Rising month-on-month. Peak: Growth moderating. Contraction: Declining. Trough: Stabilization and early recovery signals.
Interest Rates
Expansion: Rising gradually. Peak: Highest levels. Contraction: Falling rapidly. Trough: Lowest levels as stimulus kicks in.
Credit Growth
Expansion: Accelerating, banks lending aggressively. Peak: Slowing. Contraction: Credit tightens. Trough: Stabilization, gradual easing begins.
Practical Application: What This Means for Decision-Making
Understanding the cycle transforms how you approach strategic decisions. During expansion, you’re in growth mode—invest in capacity, hire talent, develop new products. The question isn’t “Can we afford this?” but “Can we afford NOT to do this?” Competitors are expanding too. Missing the growth phase means losing market share.
At the peak, caution becomes prudent. You’re not shutting down growth, but you’re being selective. Strengthen balance sheets. Lock in financing while rates are reasonable. Don’t overextend into risky markets. The peak’s when prudent risk management separates strong companies from those that’ll struggle when contraction hits.
Contraction demands flexibility and efficiency. This isn’t the time for major new initiatives. It’s about preserving cash, maintaining core operations, and keeping talented staff engaged despite uncertainty. Companies that weather contraction well typically emerge stronger because they’ve consolidated operations and eliminated inefficiencies.
The trough’s the opportunity phase. Asset prices are down. Talent’s available. When you identify the trough—when you’re confident expansion’s starting again—that’s when bold moves pay off. Acquisitions made at troughs, hires made when unemployment’s high, market share captured when competitors are defending—these decisions often deliver outsized returns.

Bringing It Together
The business cycle isn’t a prediction tool—it’s a framework for understanding where the economy sits right now. Malaysia’s cycle in 2026 shows mixed signals. Growth is recovering post-pandemic, but global uncertainties create headwinds. Manufacturing’s solid, but export demand fluctuates. Unemployment’s manageable but not declining dramatically.
The key’s monitoring those indicators consistently. Watch GDP growth trends. Track unemployment numbers monthly. Check industrial production and retail sales. When multiple indicators move in the same direction—that’s when you’ve got real clarity about which phase you’re in. And that clarity drives better decisions, whether you’re managing a business, investing capital, or planning operations.
Want deeper insights into Malaysia’s specific economic indicators? Explore our other resources on GDP measurement methods, unemployment trend analysis, and key macroeconomic indicators that professionals use daily.
Educational Information
This article provides educational information about business cycles and economic indicators for Malaysia. The examples and data referenced are illustrative and based on historical trends. Economic analysis and cycle identification involve interpretation and don’t guarantee predictive accuracy. Actual economic conditions vary by sector, region, and timeframe. For specific business decisions, investment strategies, or policy recommendations, consult with qualified economists, financial advisors, or official sources like Bank Negara Malaysia and the Department of Statistics Malaysia.